
- Видео 90
- Просмотров 79 477
Factonity
Индия
Добавлен 20 мар 2018
Factonity's resources and tutorials on Minitab, Zometric, ASQ body of knowledge, Lean Six Sigma, Operational Excellence, Manufacturing Excellence, Industry 4.0 Solutions, Statistical Process Control, Design of Experiments, Zero Defect Zero Effect, operations Digitization and more..
Realtime SPC from weighing scale
Zometric realtime SPC software module integration with Essae digital weighing scale. Call on: +91 9902243940 for details.
Просмотров: 21
Видео

Online SPC software
Просмотров 1355 месяцев назад
Demo of two of the modules in Zometric. - Online or realtime statistical process control - Statistical analysis with AI capabilities Zometric is a suit of Industry 4.0 ready solutions for paperless manufacturing.Visit www.zometric.com/ for more details. Contact us for a personalised demo or trial access.

Zometric online SPC software - auto upload data (from CMM, SAP, etc) via folder
Просмотров 1427 месяцев назад
Zometric online SPC software - auto upload data (from CMM, SAP, etc) via folder

Machine Capability vs Process Capability using Zometric Statistical Software
Просмотров 1738 месяцев назад
Machine Capability Report Through Zometric Statistical Software Understand the concept of capability & performance Machine capability, process capability & process performance The importance of stability in capability studies Correct usage of Cp, Cpk, Pp, Ppk, Pm(Traditionally Cm), Pmk(Traditionally Cmk).

Minitab attribute agreement analysis tutorial
Просмотров 1568 месяцев назад
For sample data, click here: minitab.factonity.com/training/minitab-training/minitab-examples-sample-data/

Minitab vs Zometric SPC & Statistical analysis modules comparison
Просмотров 1689 месяцев назад
Zometric realtime SPC and statistical analysis modules vs Minitab statistical analysis software. We demonstrate: *Similarities:* - Numeric results in Zometric match with Minitab - Graphical outputs in Zometric are similar to Minitab - Both cover most of the tools required for six sigma or other continuous improvement programs. *Differences:* - Zometric real-time SPC module stores master data an...

Minitab demo
Просмотров 1299 месяцев назад
A quick demo of Minitab with 3 examples: Xbar-R, IMR & Crossed GRR. Factonity is a full service distributor and reseller of many statistical software like Minitab, Zometric, Unistat and other software, ERPs and Industrial IoT systems for manufacturing industry. For a more personalised demo reach out to us on: 91-9512397111

Problem solving in manufacturing through Statistical analysis
Просмотров 13410 месяцев назад
This webinar provides manufacturing professionals with practical knowledge and skills to enhance their quality control and process improvement efforts through statistical analysis, particularly focusing on the importance of the normal distribution assumption in manufacturing applications. Expected takeaways: - Understand the relationship between variation, PPM & Cost of Poor Quality (COPQ) - Ty...

Minitab C chart tutorial
Просмотров 20410 месяцев назад
For sample data, click here: minitab.factonity.com/training/minitab-training/minitab-examples-sample-data/
Minitab U chart tutorial
Просмотров 8910 месяцев назад
For sample data, click here: minitab.factonity.com/training/minitab-training/minitab-examples-sample-data/
Minitab NP chart tuorial
Просмотров 15810 месяцев назад
For sample data, click here: minitab.factonity.com/training/minitab-training/minitab-examples-sample-data/
Minitab P chart tutorial
Просмотров 4410 месяцев назад
For sample data, click here: minitab.factonity.com/training/minitab-training/minitab-examples-sample-data/
Minitab Xbar S chart tutorial
Просмотров 36510 месяцев назад
For sample data, click here: minitab.factonity.com/training/minitab-training/minitab-examples-sample-data/
Minitab IMR chart tutorial
Просмотров 5310 месяцев назад
For sample data, click here: minitab.factonity.com/training/minitab-training/minitab-examples-sample-data/
Minitab Xbar R chart tutorial
Просмотров 224Год назад
Keywords: Minitab, Xbar-R Chart, Control Charts, Minitab tutorial, how to generate Xbar-R chart in Minitab Download sample data used in this tutorial: minitab.factonity.com/training/minitab-training/minitab-examples-sample-data/ *Introduction* Welcome to this comprehensive guide on utilizing the Xbar-R chart for process analysis and improvement using Minitab. The Xbar-R chart is a valuable stat...
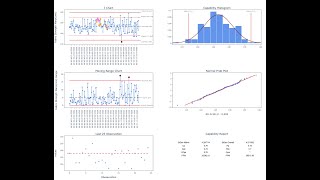
10 - Control Charts Example in Minitab
Просмотров 1314 года назад
10 - Control Charts Example in Minitab
9 - Simple Regression Example in Minitab
Просмотров 2134 года назад
9 - Simple Regression Example in Minitab
21 - MSA Example in Minitab - Part 10
Просмотров 1124 года назад
21 - MSA Example in Minitab - Part 10
11 - Capability Analysis Example in Minitab
Просмотров 1774 года назад
11 - Capability Analysis Example in Minitab
8 - Descriptive Statistics Example in Minitab
Просмотров 1304 года назад
8 - Descriptive Statistics Example in Minitab
7 - Case Studies & Examples in Minitab
Просмотров 1524 года назад
7 - Case Studies & Examples in Minitab
www.zometric.com/
Thanks
😒 Promo-SM
So brilliantly explained..
Thank you..very helpful ❤❤
What are direct and indirect techniques of data collection?
Is there a special reason they per millions data collection instead of using the normal percentages?? per 100.
The per million unit has its roots in General Electric, where a target of six sigma ( 3.4 defects per million) was set. Instead of writing decimal targets, they chose to use the per million targets.
Wow..Amazing teaching I have clear all thanks for such information Excellent
Thanks :)
Hi, great video and thanks for posting it. Check sheets, however, are not really effective in tracking defects/issues in a high variety process. Since every defect is relatively new, it becomes difficult to 'categorise' them or find identifiable patterns so as to take effective decisions. It'll be interesting to know what you think. Cheers
One of the best explanations of Nelsons Rule
sir DPU calculation man agar aik (same) defect 2 ya 3 product man araha hai ya phr aik hi product main 2 ya 3 jaga araha hai to hum usay single defect count karan gay ya phr jitni martaba araha ha either aik hi product man ya 2 say 3 main usko untni bar count karan gay???
we have to count the same defects multiple times, because the defects occur multiple times from the pieces observered.
Yes. Multiple defects in one piece are counted as multiple defects, but only as one defective piece.
This video is very informative. Clarified my doubts regarding cp and cpk, and together with examples it was made easy to grasp. Thank You.
Not solving any example using minitab.
Hi Sakinah, you can check for recorded webinars for working examples: ruclips.net/video/HLZU_GNu-4E/видео.html
Things needs to be in details.
Excellent
You just saved my university project!
41:55 Your sample size not appropriate. How do you know your random generated numbers have been distributed to each Dia as equally? Maybe number 1 that you had generated was distributed 4 or 8 times and you got the average of 4 or 8 numbers? You get an average of different sample sizes unless each generated number in your dataset repeated 5 times for n=5
Copied from some video I saw on RUclips some days before
Great work
really nice and simple. Thanks for uploading
Nicely explained. I have one doubt hear. Can somebody tell me what exactly do we mean by "Operator physical difference" under Reproducibility section. Also, how this is connected to total variation^2 = Gage R&R^2 + part to part variation^2
Hi Amit......when values of the measurement depend on who is measuring we have operator * part interaction. In real world these interactions are often seen due to some physical differences among operators. Imagine a level gauge, where one measures higher values little more than actual while lower value little less than actual. When operators are of different heights, what A thinks is 25, B will will think is 25.2 and so on. I hope this clarifies.
Yes, thanks a lot.
Good one
fabulous video.
TIMWOOD acronym for wastes
Hi Mohamed Rafi, yes TIMWOOD and WORMPIT both point to the same 7 wastes.
Thanks sir